
Your numbers today, not a week from now.
Dashboards that pull all your sources together, and maps that show what a spreadsheet hides. Every role sees what it needs.
What's wrong with your data today
Reports nobody reads
50-page PDFs. Endless tables. The answer is in there somewhere, but nobody has time to find it.
Your data is stuck in silos
Sales in one system, operations in another, finance in spreadsheets. Connecting them takes an analyst and a week.
You can't see where things happen
You have data by region but no way to see it on a map, so geographic patterns get lost in tables.
What we deliver.
Dashboards by role
Leadership sees strategic KPIs. Managers see operational metrics. Analysts get the detail. Everyone sees what they need.
All your data in one place
We connect your data sources into one view: sales, operations, finance and whatever else you need.
Your data on a map
Interactive maps with layers of data and filters by region, period and segment. Patterns you couldn't see before.
Real-time updates
No waiting for the weekly report. Data updates as it comes in, so you decide based on today's information.
How it fits together.
The pieces of a project like this, and who owns each one.
What's included
- Visualization
- Interactive maps
- Custom charts
- Interactive charts
- Export to PDF and Excel
- Your data
- Connects to your systems
- Data cleaned and merged automatically
- One home for all your data
- Fast queries as your data grows
- Access and permissions
- Sign in with your company account
- Roles that match your team
- Per-person permissions
- A log of who did what
- Speed
- Reports that load fast
- Loads only what you're viewing
- Live updates
- Fast from any city
We've built this before.

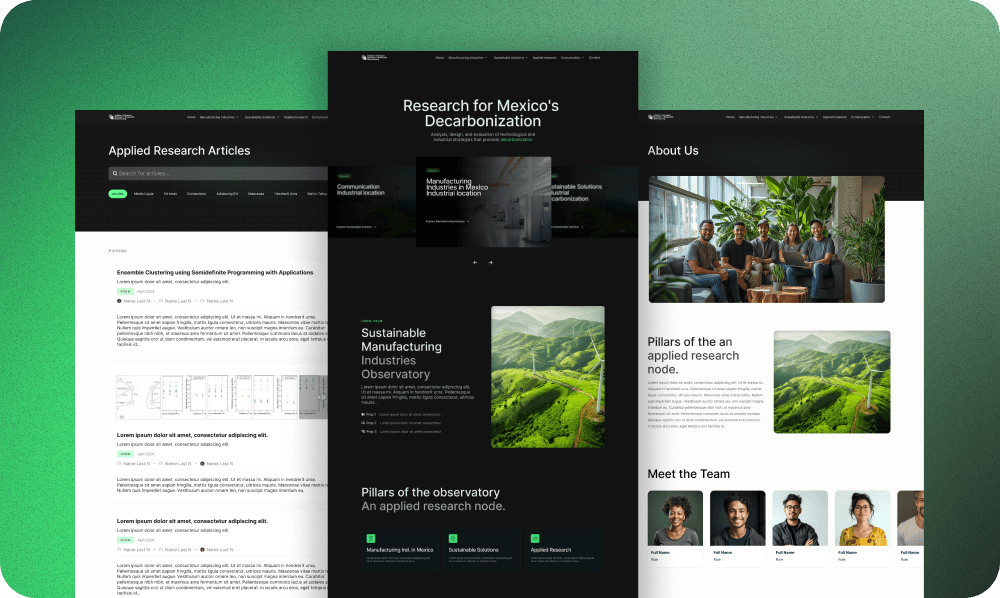
Also: COGNOS, a strategic dashboard for the pharmaceutical market with 3 user profiles and geo-referenced maps.
The risk is ours, every step of the way.
How we work with every client, from the first call to launch.
01
Discovery call
You getA clear picture of the solution, on the call itself
02
Proposal
You getA proposal with scope, timeline and price
03
Kickoff
You getA clickable prototype you sign off on
04
Weekly demos
You getAccess to test the work in progress and edit your content
05
Launch
You getTraining, documentation and 2 to 4 months of support
Questions we hear a lot.
Does everyone see the same thing?
No. Leadership sees strategic KPIs, managers see operational metrics and analysts get the detail, all with role-based permissions.
Which data sources can you connect?
Sales, operations, finance and anything else you need, in one view that updates as data comes in.
Does it include maps?
Yes: interactive maps with layers and filters by region, period or segment. MAPAMH brings more than 1,000 places to get help together on a single map.
Can I export the data?
Yes, to PDF and Excel.
Let's turn your data into decisions.
Tell us about your data sources and what you need to see. We'll come back with a dashboard plan.